By Richard Owen & Maurice Fitzgerald
Field Notes on Customer AI · Edition 002 · May 5, 2026
Each Tuesday, Field Notes surfaces what we're seeing in the field: patterns from implementations, ideas worth stress-testing, and the occasional inconvenient truth about how Customer AI programs succeed or stall. No abstractions. No product pitches. Just the working knowledge that tends to matter.
This edition covers something even we seem to have been in denial about for a long time. It's a simple fact: 94% of your customers are not talking to you.
The Field Read
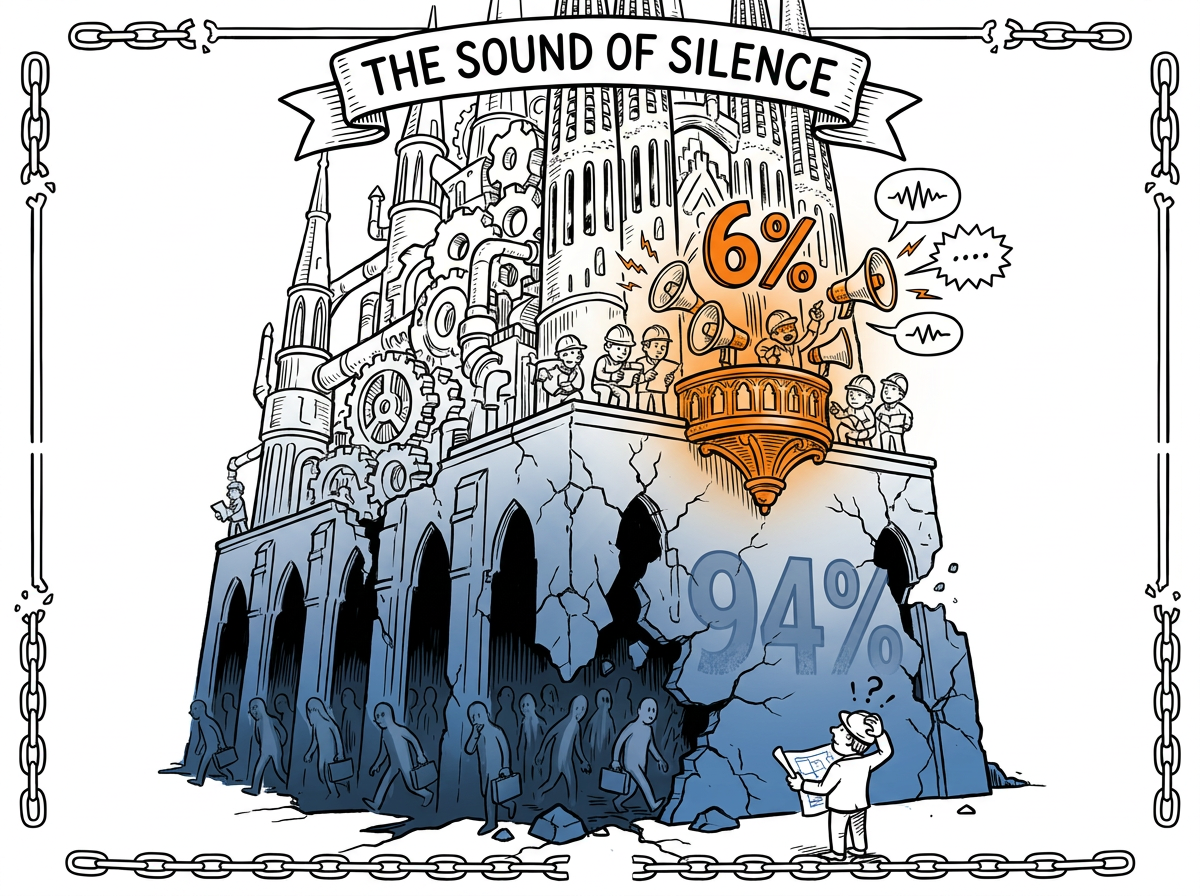
The Sound of Silence — Richard Owen
The infrastructure of customer understanding in most B2B enterprises is elaborate, expensive, and almost entirely misleading. Here is the arithmetic. Somewhere between five and thirty percent of customers respond to experience surveys, depending on channel and context. One analysis of actual B2B survey data showed averages closer to six percent. The CX industry has, in other words, built a cathedral of insight on a foundation that involves not hearing from ninety-four percent of the congregation.
This is not a temporary dip. Pew Research documented public sector survey response rates falling from thirty-six percent in 1997 to six percent by 2018: an eighty-three percent relative collapse in two decades. The Bureau of Labor Statistics saw its semi-mandatory employment surveys drop from around sixty percent to below forty-five. Even the government, armed with subpoena power and a printing press, cannot reverse the trend. The decline is structural, it spans every sector and geography, and it points in one direction.
The underlying mechanism is a classic tragedy of the commons. As the marginal cost of sending a survey has fallen toward zero, the volume has grown exponentially. Every product team, every transaction, every app now seems to generate a feedback request. The cost to the sender is negligible. From the customer's perspective, their time is not free, and it is being consumed as though it were. When everyone treats a shared resource as free, the resource degrades.
Trust erosion compounds the problem. Many B2B customers have learned through repetition that their feedback rarely leads to anything they can see. The implicit contract that once made surveys work has broken down. So they stopped answering.
The result is not merely incomplete data. Research by Bain and OCX Cognition shows that non-respondents consistently score significantly lower than respondents. Detractors and Passisves, it turns out, fill out fewer surveys than promoters. And all too many just leave. Which means the NPS number on the executive's slide is not just partial. It is systematically biased toward a picture rosier than reality warrants. A number that is both precise and wrong.
The Practitioner's Take
Silence is Absolutely Not Golden — Maurice FitzGerald
It was Valentine's Day about twelve years ago, and I was puzzled by the results of some HP customer experience research. One of our multi-billion-dollar service divisions had the rare advantage of relationship survey results for over ninety percent of its customers every year. Over a three-year period, NPS had declined by 15 points. They wanted to answer a simple question: which customers actually leave us?
The results contradicted everything I had learned about NPS. Revenue with Promoters rose slightly. Revenue with Detractors stayed flat. Revenue with Passives, the silent middle, declined close to twenty percent. Someone else had been smiling at our Passives and sending them flowers.
Think about what that means. The customers who complained, escalated, demanded and received attention stayed. They were communicating. The customers who said nothing, who marked a seven or an eight and then went quiet, were the ones who left. Silence was not satisfaction. It was the final stage before departure. We spent our energy running to the fire, fixing escalations, rebating angry customers. The customers who were actually leaving never raised their hand. They just stopped calling. One day they were gone.
So therefore: Peronally, I believe this applies to all businesses that depend on annually renewable contracts. If your CX program is organized primarily around responding to complaints and closing the loop with Detractors, you are paying attention to a small proportion of customers who are who will stay with you if you pay attention to their compalaints, and ignoring the vast majority of customers who are leaving. Reverse that priority.
The Field Tactic
Three moves this week
Three things to do this week if you suspect your survey data is telling you a story that is not true.
- Calculate your real relationship survey response rate. Not the rate for customers who received the survey. The rate against your entire customer base. If you have two thousand accounts and sixty responded, your coverage is three percent. You may also like to calculate coverage by revenue, meaning the proportion of your revenue that is covered by companies who respond to relationship surveys. These are the numbers your leadership team needs to see, because they reveals how much of your portfolio is invisible to your current program.
- Audit your last ten lost accounts. For each one, check whether they completed any relationship surveys in the twelve months before they left. If the majority did not, your survey program is not detecting churn risk. It is probably mainly documenting the customers who were already engaged enough to stay.
- Compare NPS by response frequency over the years. Split your base into frequent respondents and infrequent responders. If there is a significant gap between the two scores, and research suggests there will be, your reported NPS is systematically more optimistic than reality. Bring that gap to your next executive review. And while you have no survey-based way of knowing what score non-responders would have given, you should assume it is far lower again.
The Data Point
The number:
83%
That is the relative decline in public sector survey response rates between 1997 and 2018, according to Pew Research. Rates fell from thirty-six percent to six percent in two decades. The trend is not limited to one domain: the USDA, the Bureau of Labor Statistics, and B2B customer surveys all show the same structural decline. Post-pandemic recovery has not materialized.
If your CX program was designed in an era of thirty percent response rates and now operates in an era of six, the architecture has not adapted to its own foundation eroding underneath it.
Source: Pew Research Center, cited in Richard Owen's article, "Customer Intelligence in the Age of AI, Part 1 - The Sound of Silence."
The Iconoclast Question
This week's provocation
What percentage of your customer base actually responded to your last survey? Not the rate your CX team reports. The number of accounts who responded to relationship surveys in the last 12 months divided by your total number of accounts. If you do not know that number, that is the problem. We would be interested in learning what you find.
The Field Bridge
The Customer AI Masterclass starts with why your current data is incomplete and what replaces it. Module 3 covers the data foundations.
[ Get instant access → Click here]
Coming in future editions
- The Cost of Looking Backwards.
- The Tyranny of the Org Chart.
- Iceberg Dead Ahead? Customer Portfolio Management is Not a Game.
- Prevention Economics.
- Bad Survey Data or Pure Guesswork? A Better Solution to Both.
Field Notes publishes every Tuesday. Each edition focuses on one topic — a trap, a framework, a field observation, or a pattern worth examining. If something in here resonates, or if you're seeing something different in your own programs, we'd like to hear about it.

Responses